Forbedre din økonomiske rapportering med analytiske dimensjoner
Gjør dine økonomiske data om til klare, nyttige innsikter ved å legge til analytiske dimensjoner og bruke smarte rapporteringsverktøy.
Skrevet av Ian Kimpe & Siebe Vandenbussche – Lesetid: 4 min.
Forbedre din økonomiske rapportering med analytiske dimensjoner
I dagens forretningsverden håndterer selskaper store mengder økonomiske data. For å ta smarte beslutninger er det viktig å analysere disse dataene effektivt. Analytiske dimensjoner hjelper ved å tilføre kontekst til dine økonomiske rapporter. De lar deg bryte ned data i kategorier, noe som gjør det lettere å forstå. BrightAnalytics integrerer analytiske dimensjoner sømløst i sine rapporteringsverktøy, og eliminerer behovet for manuell databehandling.
Hva er analytiske dimensjoner?
Analytiske dimensjoner er etiketter som gir mer detalj til økonomiske data. For eksempel kan du ved registrering av en utgift merke den med den ansvarlige avdelingen.
Vanlige dimensjoner inkluderer:
Kostnadssenter
Avdeling
Lokasjon
Forretningsenhet
Prosjekt
Bruk av flere dimensjoner sammen muliggjør flerdimensjonal regnskap. Det betyr at du kan analysere økonomisk ytelse fra ulike vinkler, som for eksempel etter region og prosjekt.
5 fordeler med å bruke analytiske dimensjoner
Forbedret økonomisk oversikt
Organisering av data i kategorier hjelper deg å se detaljert økonomisk ytelse. For eksempel kan du vurdere lønnsomheten til et bestemt prosjekt eller fordele forsikringskostnader på tvers av kontorer for å forstå lønnsomheten til hvert kontor.Datadrevne beslutninger
Med detaljerte innsikter kan finansledere ta beslutninger basert på nøyaktige data i stedet for gjetninger. Dette reduserer risiko og forbedrer resultater.Innsikt på tvers av kategorier
Å kombinere dimensjoner som region og forretningsenhet kan avdekke trender som ellers kan gå tapt i samlede tall. BrightAnalytics gjør det enkelt for brukere å utforske slike kombinasjoner, noe som hjelper med å finne viktige mønstre.Forbedret strategisk planlegging
Bruk av dimensjoner som kostnadssenter og avdeling forbedrer budsjettering og prognoser. Historiske data segmentert etter dimensjoner kan avsløre mønstre som hjelper til med å forutsi etterspørsel og planlegge utgifter mer nøyaktig.Forenklet kontoplan
Analytiske dimensjoner reduserer behovet for en altfor detaljert kontoplan. Ved å kombinere dimensjoner med kontokoder oppnår organisasjoner fleksibel rapportering uten å utvide kontoplanen, noe som gir færre inkonsekvenser og mer effektiv regnskapsføring.
Utfordringer og beste praksis for flerdimensjonalt regnskap
Selv om analytiske dimensjoner gir mange fordeler, medfører de også utfordringer. Konsistens i datainnsamling er avgjørende. Det betyr at man må standardisere hvordan data registreres på tvers av avdelinger.
For å håndtere dette:
Etabler klare protokoller for datainnsamling.
Bruk automatisering for å redusere manuelle feil.
Invester i verktøy som BrightAnalytics som støtter flerdimensjonal analyse.
Tren ansatte i korrekt bruk av analytiske dimensjoner.
Revider data jevnlig for å opprettholde nøyaktighet.
Analytiske dimensjoner i BrightAnalytics
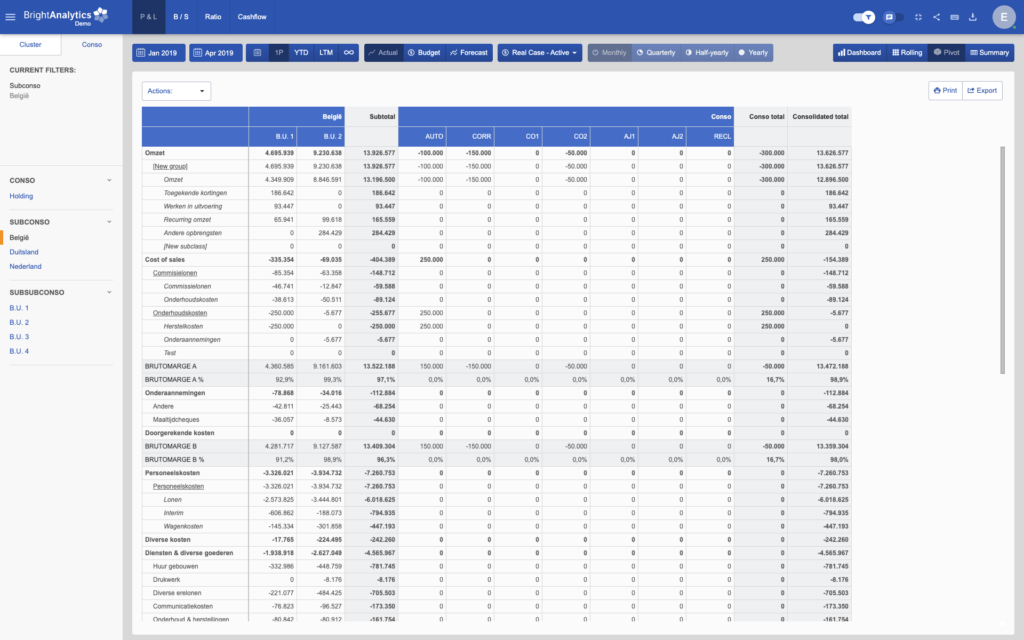
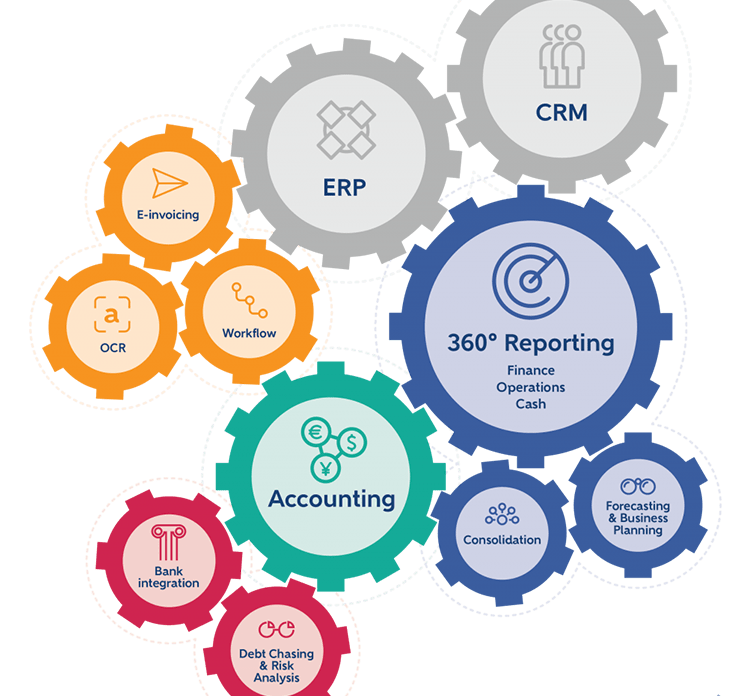
BrightAnalytics forenkler bruken av analytiske dimensjoner. Det integreres med regnskapssystemer og ERP-systemer, og gir brukerne mulighet til å:
Kombinere filtre for å lage presise rapporter.
Se data over tid.
Sammenligne dimensjoner ved hjelp av pivottabeller.
Inkludere ikke-økonomiske data, som antall ansatte per dimensjon.
I tillegg tilbyr BrightAnalytics arbeidsflyter for å tildele ikke-klassifiserte transaksjoner til riktige dimensjoner. Applikasjonen “Controlling – Dimensions” gir fleksibilitet og lar brukere generere ulike rapporter uten problemer.

Konklusjon
Analytiske dimensjoner er essensielle for effektiv økonomisk rapportering. De tilfører kontekst, hjelper selskaper med å identifisere trender og ta informerte beslutninger. BrightAnalytics gjør det enkelt å implementere og dra nytte av analytiske dimensjoner, og forvandler komplekse data til verdifulle innsikter.